
Most retail traders look at a chart and see support and resistance levels. What they often miss is why those levels exist and what is actually happening when price breaks through them. The answer comes down to liquidity: clusters of orders sitting just beyond key price levels, waiting to be triggered. Once you understand where those orders are and why price is drawn to them, the market starts to make a different kind of sense. This is the foundation of what serious traders mean when they talk about buy side and sell side liquidity.
What Liquidity Actually Means in a Trading Context
Liquidity is not just a measure of how easy an asset is to buy or sell. In the context of price action, it refers to specific zones on a chart where orders are concentrated. These concentrations form naturally because traders behave predictably: they place stop-losses above recent highs to protect short positions, and below recent lows to protect long positions. Pending orders accumulate at similar levels. The result is that certain price zones hold far more orders than others.
These concentrations are not random. They tend to cluster around identifiable features: swing highs, swing lows, round numbers, and levels that have been tested multiple times. The more times a level has been approached without breaking, the more stops and pending orders have accumulated just beyond it.
Understanding this reframes how you think about price movement. Price does not simply bounce off support and resistance because of some abstract technical significance. It bounces because a concentration of orders at that level changes the balance of supply and demand. And when price eventually breaks through, it often does so precisely because the order concentration on the other side is large enough to fuel a sustained move.
Buy-Side and Sell-Side Liquidity Defined
Buy-side liquidity sits above the market price. It forms at and above swing highs, particularly when multiple highs have formed at roughly the same level. These equal highs are a strong signal that stop-losses from short sellers and pending buy orders from breakout traders have accumulated in that zone. The concentration acts as a magnet for price.
Sell-side liquidity sits below the market price. It forms at and below swing lows, especially equal lows where several price swings have found a similar floor. Stop-losses from long traders and pending sell orders accumulate there. The same magnetic dynamic applies.
The table below summarizes the key differences:
| Feature | Buy-side liquidity | Sell-side liquidity |
|---|---|---|
| Location | Above market price, at/above swing highs | Below market price, at/below swing lows |
| Who created it | Short sellers (their stop-losses are buy orders) | Long traders (their stop-losses are sell orders) |
| What price does there | Triggers buy stops, sweeps highs | Triggers sell stops, sweeps lows |
| What follows the sweep | Often a sharp reversal downward | Often a sharp reversal upward |
| Signal on chart | Equal highs, resistance clusters | Equal lows, support clusters |
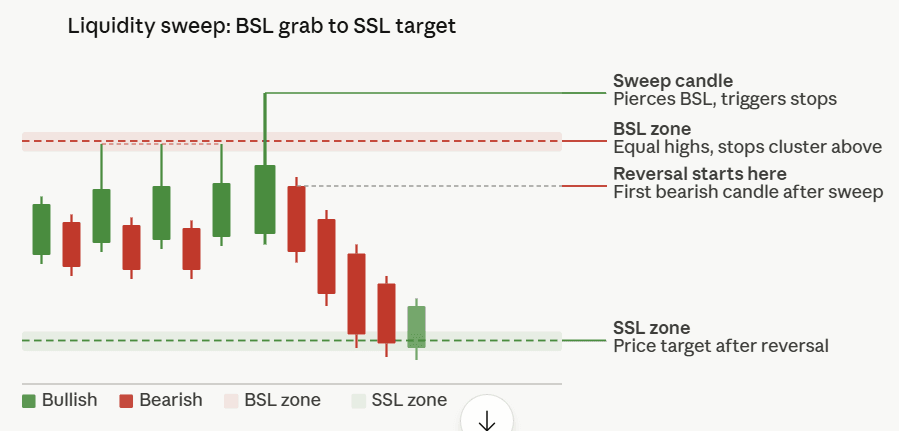
One key insight: when price breaks above a cluster of equal highs, it is not necessarily a genuine breakout. More often it is a sweep: price runs into the buy-side liquidity zone, triggers the accumulated stops, and then reverses. The stop-losses of short sellers are buy orders, so their execution provides the fuel for a brief spike above the level, after which the real direction reasserts itself.
How Smart Money Uses These Zones
Large institutional participants, banks, hedge funds, and market makers, need liquidity to fill their own large orders without moving the market against themselves. A bank trying to build a significant short position cannot simply sell into a rising market without driving prices down and worsening its own average entry. It needs buyers to absorb its selling.
This is where buy-side liquidity zones become genuinely useful to institutional players. When price sweeps above equal highs and triggers all the stop-losses and pending buys sitting there, it creates a surge of buy-side order flow. That surge is exactly what a large seller needs to offload a significant position without causing visible disruption. The spike above the highs provides the liquidity to fill the institutional short, after which price reverses.
This pattern repeats across all markets and timeframes. It is why apparent breakouts so often fail immediately after triggering stops. It is why price tends to spike briefly beyond a significant level before reversing with force. The spike is not random: it is the mechanism through which large participants access the liquidity they need.
Identifying Liquidity Zones on a Chart
Finding buy-side and sell-side liquidity zones does not require specialized tools. It requires learning to read the chart for concentrations of equal or near-equal price extremes.
Equal highs are two or more swing highs that touched a similar price level without breaking through. The more touches, the larger the potential liquidity concentration above. When you see three or four swing highs at roughly the same level, that zone is almost certainly full of stop-losses and pending orders. The same logic applies to equal lows for sell-side liquidity.
Relative equal highs and lows are another form. They do not have to be perfectly aligned. A cluster of swing highs within a tight range, say 10 to 15 pips on a one-hour chart, represents a meaningful concentration even if no two highs are at exactly the same price.
Significant round numbers and prior day or prior week highs and lows also accumulate liquidity. Retail traders tend to place stops and pending orders at obvious levels, and obvious levels are exactly where large participants look when they need order flow.
Trading the Sweep and Reversal
The practical application of liquidity concepts comes down to recognizing the sweep and positioning for the reversal that follows. The sequence is consistent: price approaches a known liquidity zone, breaks through briefly, triggers the orders sitting there, and then reverses with momentum back in the opposite direction.
The trade setup has three components. First, identify the liquidity zone: a cluster of equal highs (for a short setup) or equal lows (for a long setup) on the timeframe you are trading. Second, watch for the sweep: price breaks beyond the zone, usually with a strong candle and sometimes a wick. The sweep candle often closes back inside the zone, leaving a long wick as evidence of the rejection. Third, enter on the reversal: a strong candle closing back through the zone boundary, with a stop above the sweep wick and a target at the opposing liquidity zone.
The higher the timeframe, the more reliable the sweep signal. A sweep of daily equal highs carries far more weight than a sweep of five-minute highs, because the daily level has accumulated orders from a much larger pool of participants over a much longer period.
Conclusion
Liquidity zones are not just another chart pattern. They represent a fundamental dynamic of how markets work: orders concentrate at predictable levels, large participants use those concentrations to fill their own positions, and the resulting price behavior creates repeatable patterns that informed traders can identify and trade. Understanding buy-side and sell-side liquidity shifts the way you interpret price action, turning apparent breakouts into recognizable sweeps and reversals. It takes time to develop the eye for it, but once you see the pattern, it becomes visible on every chart and every timeframe.